
10) Characterization of Arctic Hydrologic Dynamics Using Supervised Machine Learning
 Recent studies suggest that the Arctic is warming twice as fast as the rest of the planet, making it increasingly crucial to observe Arctic systems such as rivers and sea ice to better understand their vulnerability to the warming Earth. Recent advances in satellite sensor capabilities have made it possible to monitor near continuously and at the global scale these otherwise difficult-to-access dynamic structures. With the rapid influx of remotely sensed data products spanning pan-Arctic regions, machine learning has become a powerful tool in monitoring critical Arctic processes. Here, we apply supervised Machine Learning (ML) techniques to remote sensing data products derived from the Sentinel satellites over Arctic sea ice and the Copper River in Alaska to detect changes in river ice and melt pond dynamics. We evaluate the performance of the ML algorithm in capturing the evolution of these dynamic systems over several freeze-up and melt seasons.
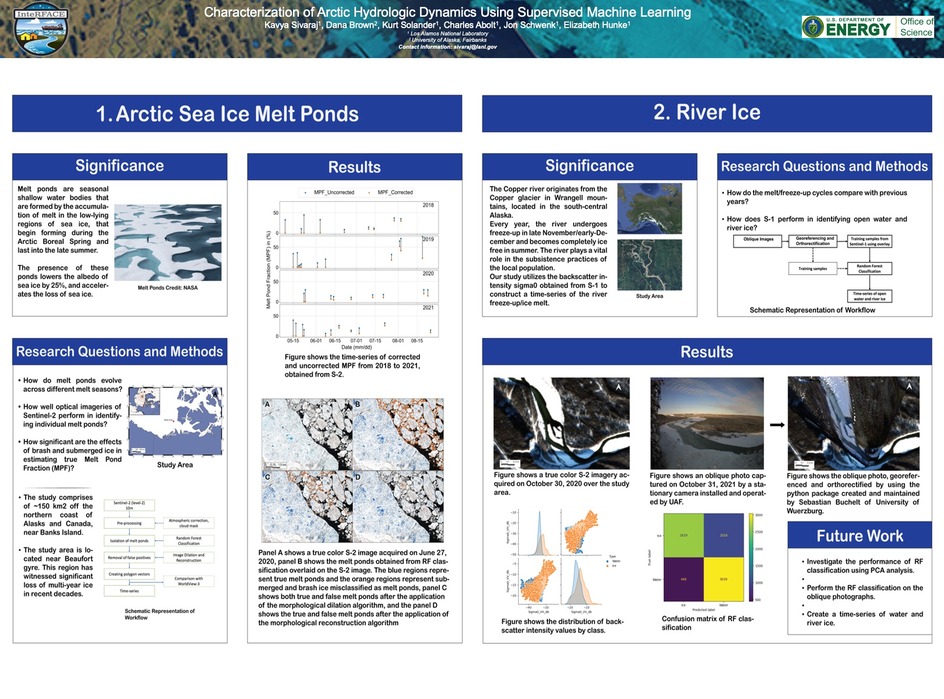
Arctic melt ponds: Melt ponds are shallow ponded structures that develop on the low-lying regions of sea ice by the accumulation of meltwater during summer. The presence of melt ponds on the surface of sea ice lowers the overall albedo of the region, thereby accelerating the loss of sea ice. Here, we construct a time-series of melt pond surface area through multiple melt seasons by employing a Random Forest (RF) classification to the true color imageries acquired by Sentinel-2 (S-2) with a spatial resolution of 10 m. Our results show that the formation of melt ponds varies significantly between each melt season, with the Melt Pond Fraction (MPF) reaching a maximum of 51%. Our workflow involves the employment of two image processing algorithms – morphological dilation and morphological reconstruction – to remove the misclassifications of melt ponds caused by submerged ice, nilas, and brash ice. The resulting Melt Pond Fraction (MPF) estimates derived from S-2 imagery are compared to estimates from WorldView-3 (WV-3) imagery (spatial resolution < 2m), which reveals that the S-2 image experienced a reduction of ~50% in MPF after removing the misclassifications compared to only ~20% for the WV-3 image. Our results suggest that misclassifications vary significantly for sensors of different spatial resolutions and that the estimates from different sensors cannot be compared directly without excluding the misclassifications, contrary to an assumption made in a previous study.
Copper River, Alaska: The Copper River located in the south-central region of Alaska originates from the Copper glacier in the Wrangell Mountains and extends 290 miles before draining into the Gulf of Alaska. Every year, the river undergoes freeze-up during the Winter, starting in late November/early December. The river ice reaches its maximum extent in the Spring before melting off entirely in the Summer. Our study aims to construct a time-series of river ice/open water fractions by employing an RF classification to the Synthetic Aperture Radar (SAR) imageries obtained from Sentinel-1 (S-1) sensors. S-1 provides backscatters in VV/VH polarizations and less than six days of temporal resolution in Interferometric Wide (IW) swath over the Copper River. We calculate backscatter coefficients (s0) for the VV/VH polarizations and perform a Principal Component Analysis (PCA) and a Gray-Level Co-occurrence Matrix (GLCM) analysis on s0, which are then used as input features for the RF classifier. Results from our analysis can be used to inform changes in the freeze-up/break-up patterns of the river ice of which the local populations rely on for transportation and subsistence fishing practices.