
Quantifying Drivers of Carbon Dioxide Interannual Variability
Quantify the contributions of known drivers of interannual variability in the growth rate of atmospheric carbon dioxide (CO2).
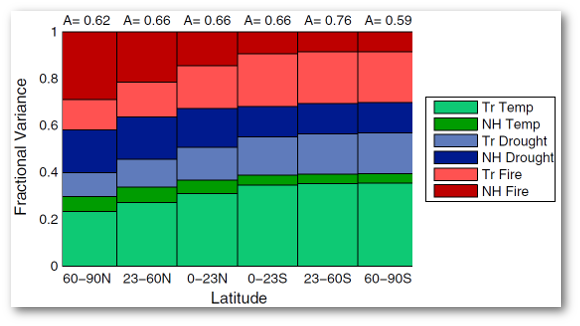
We examined how the temporal evolution of CO2 in different latitude bands may be used to separate contributions from temperature stress, drought stress, and fire emissions to CO2 variability.
- Net ecosystem exchange (NEE) responses to temperature, drought, and fire emissions all contributed significantly to CO2 variability; no single mechanism was dominant.
- Combined, drought and fire contributions to CO2 variability exceeded direct NEE responses to temperature in both the Northern and Southern Hemispheres.
- Accounting for fires, the sensitivity of tropical NEE to temperature stress decreased by 25% to 2.9 ± 0.4 Pg C yr-1 K-1.
- Results will inform the improvement of the representation of terrestrial ecosystem processes in Earth system models.
This work was supported by the Department of Energy Office of Science Biological and Environmental Research Division, the National Science Foundation Decadal and Regional Climate Prediction using Earth System Models (EaSM) program (NSF AGS 1048890 and AGS 1048827), and NASA Carbon Cycle Science (NASA NNX11AF96G). G.K.A. acknowledges a NOAA Climate and Global Change postdoctoral fellowship. J.B.M. and E.J.D. thank NOAA’s Climate Program Office’s Atmospheric Chemistry, Carbon Cycle, and Climate (AC4) program for support, including that for collection and analysis of CO2 observations used in this study. CO2 observations were downloaded from ftp://aftp.cmdl.noaa.gov/data/trace_gases/co2/flask/surface/. NCEP Reanalysis data were provided by the NOAA/OAR/ESRL PSD, Boulder, Colorado, USA, from their Web site at http://www.esrl.noaa.gov/psd/. CRU temperature data were retrieved from http://www.cru.uea.ac.uk/cru/data/temperature/#datdow. GPCP data were from precip.gsfc.nasa.gov, and GFED data were from http://www.globalfiredata.org/Data/index.html.